Debugging Jupyter Enterprise Gateway#
This page discusses how to go about debugging Enterprise Gateway. We also provide troubleshooting information in our Troubleshooting Guide.
Configuring your IDE#
While your mileage may vary depending on which IDE you are using, the steps below (using PyCharm as an example) should be useful for configuring a debugging session for Enterprise Gateway with minimum adjustments for different IDEs.
Creating a new Debug Configuration#
Go to Run->Edit Configuration and create a new python configuration with the following settings:
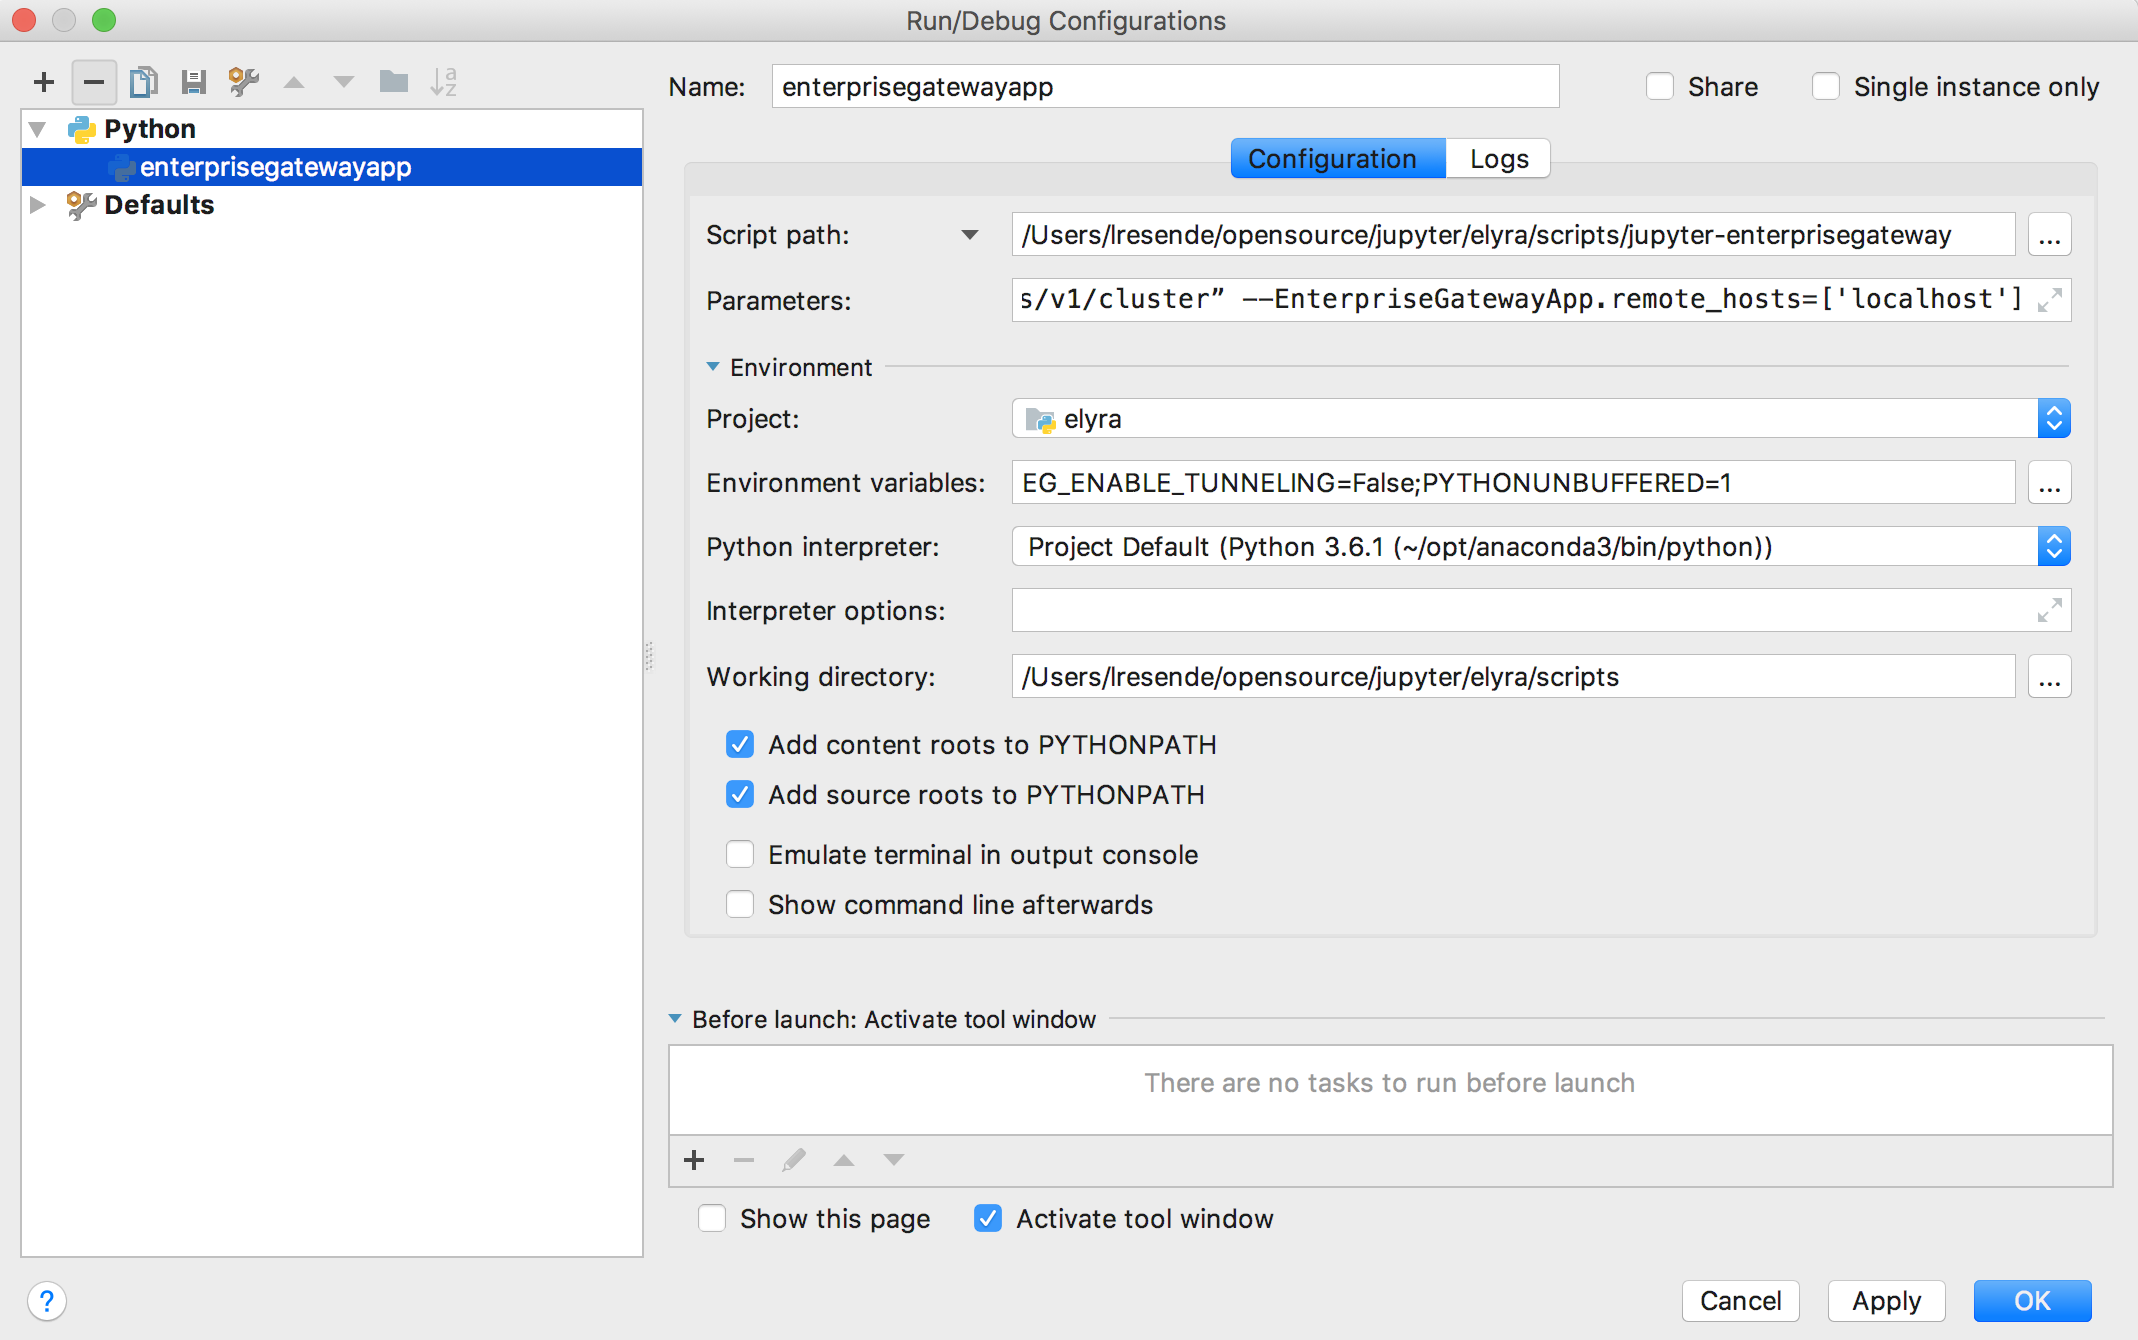
Script Path:
/Users/jovyan/opensource/jupyter/elyra/scripts/jupyter-enterprisegateway
Parameters:
--ip=0.0.0.0
--log-level=DEBUG
--EnterpriseGatewayApp.yarn_endpoint=“http://elyra-fyi-node-1.fyre.ibm.com:8088/ws/v1/cluster”
--EnterpriseGatewayApp.remote_hosts=['localhost']
Environment Variables:
EG_ENABLE_TUNNELING=False
Working Directory:
/Users/jovyan/opensource/jupyter/elyra/scripts
Running in debug mode#
Now that you have handled the necessary configuration, use Run-Debug and select the debug configuration you just created and happy debugging!